General Stats Features
Stats is one of the Sequence features that displays a statistical summary and analysis of each SEO metric for your domain. Analytical data is presented in an attractive visualization to make it easier for you to understand the data
You can also make set up in one of the views, by pressing the pencil icon to the right of the view name and then entering new data in it. For more information, see the following guide.
Displayed Data
In general, Sequence displays summary information based on the currently active View in your Stats dashboard. In other words, the view display represents each domain, where different domains will have different statistical results. The summary view shows the current aggregated data of all the keywords in that view.
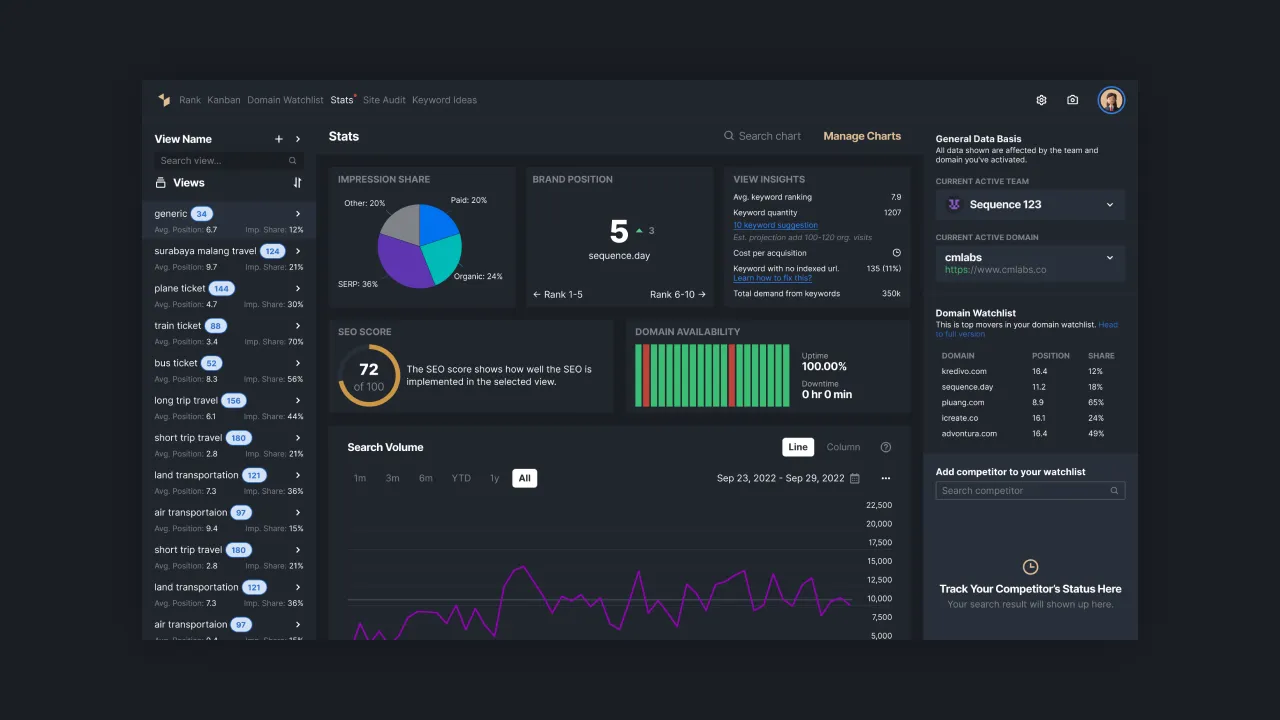
View Summary can be seen at the top of the Stats dashboard. Sequence will display and update the analytical results for your domain every day. The metrics displayed include Impression Share, Brand Position, Average Keyword Ranking, Keyword Quantity, Estimated Cost Acquisition, keywords with no indexed URL, and Total Demand.
 |
|---|
| Figure 1 - Stats Dashboard |
Under the summary data View, there are multiple charts showing data for each metric. In this phase, users cannot customize the Stats workspace so that the displayed data cannot be edited or hidden.
In this Stats section, this tool displays some important SEO metrics such as:
- Average Ranking: Average rank in the current View, updated daily.
- Brand Position: Brand position compared to competitors in the same target market
- Market Share: the value of the market share of your domain compared to competitors in the same market.
- Rank Distribution: the distribution of keyword rankings in the SERP, both organic rankings and absolute rankings of certain domains.
- Impression Share: the percentage of impressions your site or ad managed to get compared to the number of impressions it was entitled to get.
- Search Volume: the number of searches of all keywords in the currently active View.
- Competition Index: the index value of how competitive the keywords in the View are to be used as adverts
- High Keyword Bid: a list of the highest bid values of the keywords in the View
- Low Keyword Bid: a list of the lowest bid values of the keywords in the View
 |
|---|
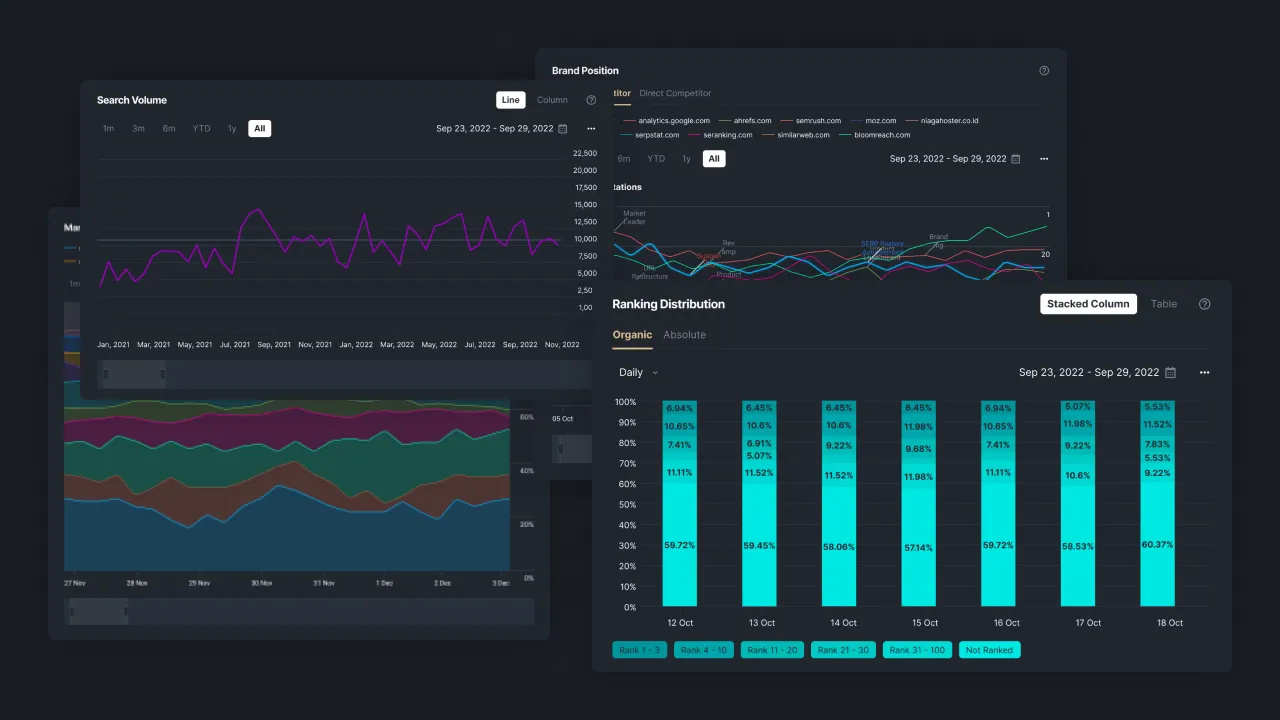
| Figure 2: Stats feature charts |
It displays data from all of the above metrics with attractive visualizations so that users can understand them thoroughly. Users can also set the appearance of each metric such as changing the table type, time range, and more.
For more details, we have explained each of the above metrics in separate articles. If you need our help, please send us a message via [support@sequence.day](mailto: support@sequence.day)